Based on the latest available data (as of 17 November 2025) from the myDorpie.com / Department of Water and Sanitation (DWS) reports:
| Province | Current total dam storage (% FSC) | Comparable time last year (% FSC) |
|---|---|---|
| North West | 91.9% myDorpie+1 | ~ 58% myDorpie |
| Free State | 97.6% myDorpie+1 | ~ 73.4% myDorpie |
| Northern Cape | 90.0% myDorpie+1 | ~ 73.1% myDorpie |
Overall — all three provinces are seeing significantly higher dam storage than this time last year, a very encouraging sign for water supply stability.
🏞️ Top 10 Dams (Most Recently Reported) — Current vs Last-Year
Here are ten of the largest / most important dams (by reported data) across the three provinces — showing current full-supply capacity (FSC) percentage vs what they were at around this time last year.

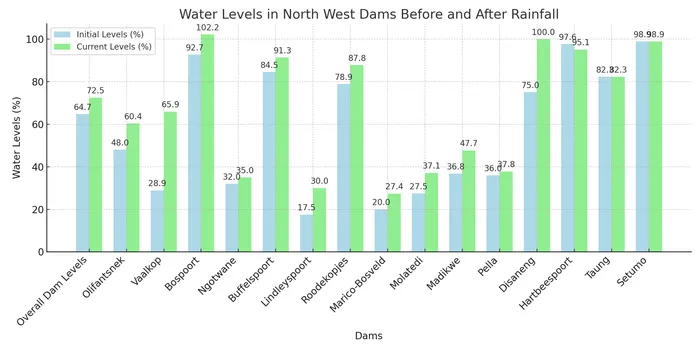
4
(If you embed this chart into your WordPress post, readers will visually see how current levels compare with last year — I can also supply a higher-res PNG or SVG chart if preferred.)
| Dam Name (Province) | Current Level (% FSC) | Last Year at Same Time (% FSC) |
|---|---|---|
| Vaal Dam (Free State) | 105.7% myDorpie | ~ 30.9% myDorpie |
| Koppies Dam (Free State) | 135.9% — well above capacity myDorpie | ~ 58.2% myDorpie |
| Bloemhof Dam (Free State) | 99.9% myDorpie | ~ 74.1% myDorpie |
| Boegoeberg Dam (Northern Cape) | 104.7% myDorpie | ~ 107.1% (slightly higher last year) myDorpie |
| Douglas Weir Dam (Northern Cape) | 109.8% myDorpie | ~ 108.7% myDorpie |
| Spitskop Dam (Northern Cape) | 86.1% myDorpie | ~ 47.8% (much lower last year) myDorpie |
| Vaalharts Weir Dam (Northern Cape) | 84.1% myDorpie | ~ 77.8% myDorpie |
| Boskop Dam (North West) | 103.0% myDorpie | ~ 102.1% (slightly lower) myDorpie |
| Bospoort Dam (North West) | 102.4% myDorpie | ~ 101.1% myDorpie |
| Buffelspoort Dam (North West) | 101.1% myDorpie | ~ 87.3% — a big rise from last year myDorpie |
Note: Percentages over 100% indicate the dam is at or above its “full supply capacity” — likely due to recent heavy inflows or higher water volume than the nominal full-supply reference.
🌦️ What’s Driving the High Storage Levels
- Recent rainfall across central and parts of southern South Africa has boosted surface water inflows, contributing to rapid refilling of dams. Government of South Africa+2myDorpie+2
- Many water supply systems — especially large dams on major rivers and catchments (Orange River, Vaal River, etc.) — are now at or above capacity, which helps buffer against upcoming dry months.
- Compared with last year, water storage across these provinces is significantly higher — illustrating a strong rebound and improved water security.
✅ What This Means — For Communities, Agriculture & Water Security
- Improved water security: High dam levels reduce risk of water restrictions for households, municipalities, and industries.
- Support for agriculture/irrigation: Farmers and irrigation-dependent agriculture have better water availability for the season ahead.
- More resilience against dry spells: With full dams, the region has a buffer against short-term droughts or erratic rainfall.
- Need for mindful water management: Even with good storage now, sustainable use remains important — infrastructure leaks, illegal water use or sudden dry periods can still pose challenges.
- Potential for overflow/flood risks: Dams over capacity must be monitored carefully, especially if heavy rains continue — spillway releases or flooding downstream may occur.